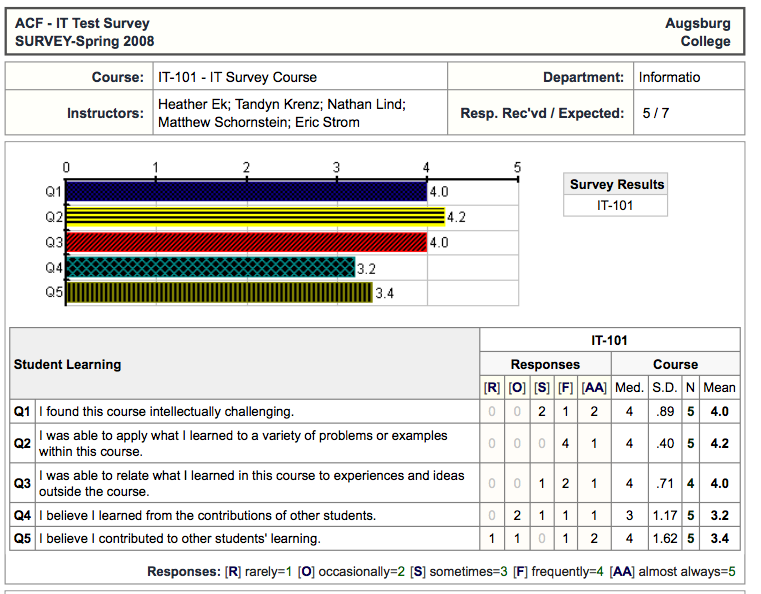
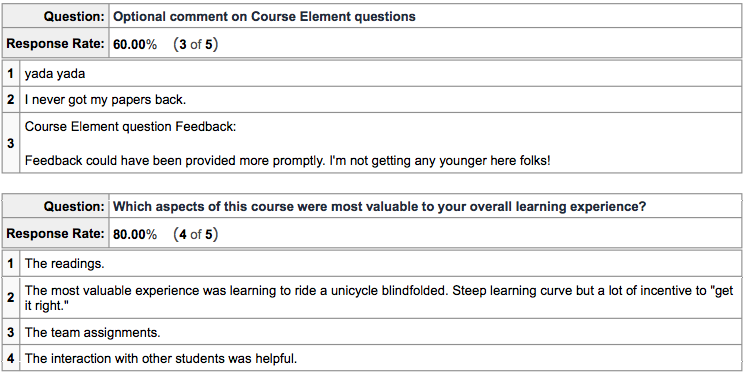
If you wonder what feedback faculty actually receive from a course evaluation, you can examine the sample faculty report below. The example is for a made up course.
The evaluation report begins with a summary of the course, term, instructor and response rate (5 of 7 received). Each question has a graph showing the average score for each question (the actual report also includes comparisons to other courses in the program and to all courses during the term) followed by a table showing how many students picked each answer on the scale. All of the questions that have a scaled answer appear this way.

Any open-ended question will show the exact responses entered by students. They are numbered so that faculty can easily tell them apart. It is possible that different students gave response 1 in each question. The responses are anonymous.

